Anton | 07 March 2024
As the use of high-load systems and clusters becomes more widespread in 2024, maintaining the system’s observability remains crucial to ensuring its reliability. In the world of Kubernetes, where clusters can contain hundreds if not thousands of workloads, it’s necessary to set up an informative logging solution across all system parts - including cluster components and workloads. Therefore, any well-maintained cluster must have a powerful and flexible logging tool.
In this blog post, we explore the Fluent Operator logging tool, its main components and features, the modes you can run it and how it can be used in its more lightweight setup by collecting the cluster’s logs and forwarding them to the logs’ aggregator or another final destination.
Fluent Operator has been introduced as a universal solution for Kubernetes cluster logging, which includes both Fluent Bit and Fluentd logging tools out of the box. Support of both tools helps Fluent Operator to achieve better flexibility in building a complex logging layer of the cluster as both of these tools are suited to different use cases, and can be used simultaneously to get the level of logging you need.
Fluent Operator’s main benefits are:
Kubernetes CRDs (Custom Resource Definitions)Operator (main controller)See the values.yaml for all available fields.
- A wide list of plugins: Fluent Bit and Fluentd support a lot of different plugins, including input, output & filter, which are the main configuration mechanisms in Fluent Operator. These plugins allow engineers to adjust Fluent Operator to almost any technical stack. See the full plugins list.
- Dynamic configuration updates: Fluent Operator supports dynamic configuration updates for the Fluent Bit and Fluentd without rebooting any pods. This helps achieve zero downtime of the logging stack.
- Pluggable deployment: Fluent Bit and Fluentd can be deployed and used separately without being bound to each other, providing extra flexibility.
The points listed above show that Fluent Operator is a powerful tool compared to other logging stacks available, however, its most attractive benefit is that it’s completely open source.
Fluent Operator consists of the following components:
- Fluent Operator Controller: This is the main controller that takes responsibility for all other components of the system, and uses the regular Kubernetes kind: Deployment resource.
- Fluent Bit: This is the Kubernetes DaemonSet that scrapes the logs and manages them according to the applied configuration using CRDs listed above.
- Fluentd: This is the Kubernetes StatefulSet that processes the logs received from Fluent Bit according to the applied configuration using CRDs listed above.
- Custom Resource Definitions: CRDs provide the creation of any Fluent Bit/Fluentd configurations as well as Fluent Bit/Fluentd themselves. The common CRDs include fluentbit.fluent.io, fluentd.fluent.io, clusterfilters.fluent.io, clusteroutputs.fluent.io, clusterfilters.fluent.io.
Given the Fluent Operator components listed above you might question: what if I don’t need all these components, which consume extra resources of my cluster? Can I instead use a simple setup so I can check the logs of my workloads in one single place?
This is where the different Fluent Operator modes come to the rescue!
There are three main modes for Fluent Operator to run in:
- Fluent Bit only: This mode is a more lightweight setup that uses only Fluent Bit for collecting the logs, basic filtering and sending logs to the final destinations. The application for this is simple use-cases which need Fluent Operator only to collect the Kubernetes workloads’ logs.
- Fluentd only: This mode is primarily used for working with large quantities of log data in large systems. It is more powerful and processes the logs through networks such as HTTP or Syslog.
- Fluent Bit + Fluentd: This mode uses the best of both tools. It provides advanced log processing where Fluent Bit only, the lightweight setup, might not be enough. This mode is primarily used by applying Fluent Bit to scrape the logs and send them to Fluentd, while Fluentd executes complex logs processing unsupported by Fluent Bit.
To summarise, Fluent Operator can fit any scenario requiring system logs. Now let’s jump into the practical part to see Fluent Operator in action!
In this practical part we will demonstrate Fluent Operator’s usage in its simpler setup to fulfil the need to collect the cluster logs and forward them to their final destinations. We will run Fluent Operator in Fluent Bit only mode as this lightweight mode is enough to showcase the flexibility of the Fluent Operator stack.
We will explore two usage examples:
Simple Log Collection on the Filesystem - Demonstrating the usage of Fluent Operator for forwarding and collecting logs on a cluster node’s filesystem
Advanced integration with log aggregators - Showing a more complex Fluent Operator use case for forwarding logs to the Loki logs processor and observing them in Grafana
But before we can do this, let’s take a look at the prerequisites needed:
kubectl apply -f - <<EOF
apiVersion: v1
kind: Pod
metadata:
  name: hello-world-logger
  labels:
    app: logger
spec:
  containers:
  - name: logger
    image: busybox
    command: ["/bin/sh"]
    args:
    - -c
    - |
      while true; do
        echo "$(date) - hello world"
        sleep 30;
      done
EOF
So let’s start with the deployment and common configuration of the Fluent Operator, including the installation of Fluent Bit and configuring node filesystem storage support for the logs. We use a Helm chart overriding custom values to deploy Fluent Operator into the cluster (refer to the default values if needed). See the custom values block we’ve used below:
containerRuntime: containerd
fluentbit:
  crdsEnable: true
  enable: true
  additionalVolumes:
    - name: file-output-node
      hostPath:
        path: /tmp/fluent-logs
  additionalVolumesMounts:
    - mountPath: /tmp/fluent-logs
      mountPropagation: HostToContainer
      name: file-output-node
Let’s take a deeper look at the values we’ve redefined.
containerRuntime has been set to containerd, as it is the Container Runtime of the example cluster we use (you can identify your cluster’s runtime of use by checking this Kubernetes docs page).
fluentbit.enable has been set to true so that we can leverage the Fluent Bit in our setup.
additionalVolumes with additionalVolumesMounts declare that the hostPath Kubernetes volume will be attached on each of the Fluent Bit DaemonSet pods using the /tmp/fluent-logs path for both Fluent Bit pod and its host node. We will use this path to collect and store cluster logs later.
Now we can deploy the Fluent Operator Helm chart using the next command (the version we use in this blog post is v2.6.0):
$ helm install -f custom-values.yaml fluent-operator --create-namespace -n fluent-operator https://github.com/fluent/fluent-operator/releases/download/v2.6.0/fluent-operator.tgz
After the Helm chart has been deployed we can check the pods of the Fluent Operator:
$ kubectl get pod -n fluent-operator -o wide
NAME                               READY   STATUS    RESTARTS   AGE     IP             NODE                                    NOMINATED NODE   READINESS GATES
fluent-bit-8ndcs                   1/1     Running   0          4m     10.244.2.3     fluent-blog-md-0-qx2hh                    <none>           <none>
fluent-bit-bzb4r                   1/1     Running   0          4m     10.244.0.128   fluent-blog-control-plane-tpgtl           <none>           <none>
fluent-bit-ndh2r                   1/1     Running   0          4m     10.244.1.223   fluent-blog-md-0-hdbgx                    <none>           <none>
fluent-operator-6fb4b494f4-vzks8   1/1     Running   0          4m     10.244.2.251   fluent-blog-md-0-qx2hh                    <none>           <none>
We can see that the Fluent Bit is present on each of the nodes because it acts as a logs scraper (e.g. it retrieves the logs for all the containers as well as cluster components running on the corresponding node).
Let’s now try to forward the logs to the filesystem storage of the cluster nodes. The first thing we need to do is to create the ClusterOutput Custom Resource using File Output Plugin. This custom resource will tell Fluent Operator to put all the logs into a specific path on the filesystem (the one we’ve defined in the custom-values.yaml as part of the installation stage).
apiVersion: fluentbit.fluent.io/v1alpha2
kind: ClusterOutput
metadata:
  labels:
    fluentbit.fluent.io/component: logging
    fluentbit.fluent.io/enabled: "true"
  name: file
  namespace: fluent-operator
spec:
  file:
    path: /tmp/fluent-logs
  match: '*'
Use the command kubectl apply -f fluent-output-file.yaml to create the above ClusterOutput.
We can check the result by watching the logs of Fluent Operator and Fluent Bit as well as checking the common Fluent Bit config in the cluster.
Let’s first check the logs of the Fluent Operator controller:
$ kubectl logs -n fluent-operator fluent-operator-6fb4b494f4-vzks8 --tail=5
2024-02-20T14:18:32Z    INFO    controllers.FluentBitConfig     Fluent Bit main configuration has updated       {"logging-control-plane": "fluent-operator", "fluentbitconfig": "fluent-bit-config", "secret": "fluent-bit-config"}
2024-02-20T14:21:48Z    INFO    controllers.FluentBitConfig     Fluent Bit main configuration has updated       {"logging-control-plane": "fluent-operator", "fluentbitconfig": "fluent-bit-config", "secret": "fluent-bit-config"}
2024-02-20T14:27:55Z    INFO    controllers.FluentBitConfig     Fluent Bit main configuration has updated       {"logging-control-plane": "fluent-operator", "fluentbitconfig": "fluent-bit-config", "secret": "fluent-bit-config"}
2024-02-20T14:36:31Z    INFO    controllers.FluentBitConfig     Fluent Bit main configuration has updated       {"logging-control-plane": "fluent-operator", "fluentbitconfig": "fluent-bit-config", "secret": "fluent-bit-config"}
2024-02-20T14:44:45Z    INFO    controllers.FluentBitConfig     Fluent Bit main configuration has updated       {"logging-control-plane": "fluent-operator", "fluentbitconfig": "fluent-bit-config", "secret": "fluent-bit-config"}
The tail of the log informs us that the main config of the Fluent Bit has just been updated. We will verify this using the below command which prints all the config of the Fluent Bit:
$ kubectl get secrets -n fluent-operator fluent-bit-config -o jsonpath="{.data['fluent-bit\.conf']}" | base64 -d
[Service]
    Http_Server    true
    Parsers_File    parsers.conf
<--------- skipped --------->
[Output]
    Name    file
    Match    *
    Path    /tmp/fluent-logs
The config now contains the Output section with “file” configured to put the logs into the path we’ve specified in the correspondent ClusterOutput custom resource. Finally let’s check that the Fluent Bit is aware of these config changes by viewing its log (we’ll skip the full log and show only the important bits).
$ kubectl logs -n fluent-operator fluent-bit-8ndcs
level=info time=2024-02-20T14:36:39Z msg="Fluent bit started"
<--------- skipped --------->
[2024/02/20 14:45:25] [engine] caught signal (SIGTERM)
level=info time=2024-02-20T14:45:25Z msg="Config file changed, stopping Fluent Bit"
level=info time=2024-02-20T14:45:25Z msg="Sent SIGTERM to FluentBit, waiting max 30s"
[2024/02/20 14:45:25] [ warn] [engine] service will shutdown in max 5 seconds
[2024/02/20 14:45:25] [ info] [input] pausing systemd.0
[2024/02/20 14:45:25] [ info] [input] pausing tail.1
[2024/02/20 14:45:26] [ info] [engine] service has stopped (0 pending tasks)
<--------- skipped --------->
level=info time=2024-02-20T14:45:26Z msg="Fluent bit started"
<--------- skipped --------->
[2024/02/20 14:45:26] [ info] [output:file:file.0] worker #0 started
[2024/02/20 14:45:26] [ info] [http_server] listen iface=0.0.0.0 tcp_port=2020
[2024/02/20 14:45:26] [ info] [sp] stream processor started
<--------- skipped --------->
Following the log of the Fluent Bit we can see that its service has been auto-restarted after the "Config file changed" action occurred, and the new "output:file worker" has been created. It’s a real-world example of the Dynamic configuration updates feature, which achieves zero downtime as there is no need to restart the Fluent Bit pod.
As an outcome we can verify that the logs are collected by the specified host path. For that we need to check which node hosts the logger application we created (as part of the Prerequisites) and ssh into that node (use the command kubectl get pod -o wide to get an idea of the pods distribution across the nodes). After we’ve successfully entered the needed node we can check if the path we’ve specified in the ClusterOutput contains any logs stored inside.
anton@fluent-blog-md-0-qx2hh:~# ls /tmp/fluent-logs/
kube.var.log.containers.hello-world-logger_default_logger-0db7063c83bc5208f6810a90b502264949fc2c5014c3d8a738f8d6b1d0620074.log
kube.var.log.containers.hello-world-logger_default_logger-a94d47b17f85909d63edeabcee4daf1ff977ca243ba2407a7543eb7475602781.log
service.containerd.service
service.kubelet.service
As it’s shown in the snippet above there are a few log files in the specified node path including logger application along with Kubernetes components’ logs (kubelet and containerd). Let’s see what’s inside the logger application log file.
anton@fluent-blog-md-0-qx2hh:~# cat /tmp/fluent-logs/kube.var.log.containers.hello-world-logger_default_logger-0db7063c83bc5208f6810a90b502264949fc2c5014c3d8a738f8d6b1d0620074.log
kube.var.log.containers.hello-world-logger_default_logger-0db7063c83bc5208f6810a90b502264949fc2c5014c3d8a738f8d6b1d0620074.log: [1708448851.346635559, {"logtag":"F","time":"2024-02-20T17:07:31.346635559Z","log":"Tue Feb 20 19:07:24 EET 2024 - hello world","kubernetes":{"pod_name":"hello-world-logger","namespace_name":"default","labels":{"app":"logger"},"annotations":{"kubectl.kubernetes.io/last-applied-configuration":"{\"apiVersion\":\"v1\",\"kind\":\"Pod\",\"metadata\":{\"annotations\":{},\"labels\":{\"app\":\"logger\"},\"name\":\"hello-world-logger\",\"namespace\":\"default\"},\"spec\":{\"containers\":[{\"args\":[\"-c\",\"while true; do\\n  echo \\\"$(date) - hello world hello world hello world hello world hello world hello world hello world hello world hello world hello world hello world hello world\\\"\\n  sleep 30;\\ndone\\n\"],\"command\":[\"/bin/sh\"],\"image\":\"busybox\",\"name\":\"logger\"}]}}\n"},"container_name":"logger","docker_id":"a94d47b17f85909d63edeabcee4daf1ff977ca243ba2407a7543eb7475602781","container_image":"docker.io/library/busybox:latest"}}]
kube.var.log.containers.hello-world-logger_default_logger-0db7063c83bc5208f6810a90b502264949fc2c5014c3d8a738f8d6b1d0620074.log: [1708448881.347046520, {"logtag":"F","time":"2024-02-20T17:08:01.347046520Z","log":"Tue Feb 20 19:07:24 EET 2024 - hello world","kubernetes":{"pod_name":"hello-world-logger","namespace_name":"default","labels":{"app":"logger"},"annotations":{"kubectl.kubernetes.io/last-applied-configuration":"{\"apiVersion\":\"v1\",\"kind\":\"Pod\",\"metadata\":{\"annotations\":{},\"labels\":{\"app\":\"logger\"},\"name\":\"hello-world-logger\",\"namespace\":\"default\"},\"spec\":{\"containers\":[{\"args\":[\"-c\",\"while true; do\\n  echo \\\"$(date) - hello world hello world hello world hello world hello world hello world hello world hello world hello world hello world hello world hello world\\\"\\n  sleep 30;\\ndone\\n\"],\"command\":[\"/bin/sh\"],\"image\":\"busybox\",\"name\":\"logger\"}]}}\n"},"container_name":"logger","docker_id":"a94d47b17f85909d63edeabcee4daf1ff977ca243ba2407a7543eb7475602781","container_image":"docker.io/library/busybox:latest"}}]
kube.var.log.containers.hello-world-logger_default_logger-0db7063c83bc5208f6810a90b502264949fc2c5014c3d8a738f8d6b1d0620074.log: [1708448911.347731521, {"logtag":"F","time":"2024-02-20T17:08:31.347731521Z","log":"Tue Feb 20 19:07:24 EET 2024 - hello world","kubernetes":{"pod_name":"hello-world-logger","namespace_name":"default","labels":{"app":"logger"},"annotations":{"kubectl.kubernetes.io/last-applied-configuration":"{\"apiVersion\":\"v1\",\"kind\":\"Pod\",\"metadata\":{\"annotations\":{},\"labels\":{\"app\":\"logger\"},\"name\":\"hello-world-logger\",\"namespace\":\"default\"},\"spec\":{\"containers\":[{\"args\":[\"-c\",\"while true; do\\n  echo \\\"$(date) - hello world hello world hello world hello world hello world hello world hello world hello world hello world hello world hello world hello world\\\"\\n  sleep 30;\\ndone\\n\"],\"command\":[\"/bin/sh\"],\"image\":\"busybox\",\"name\":\"logger\"}]}}\n"},"container_name":"logger","docker_id":"a94d47b17f85909d63edeabcee4daf1ff977ca243ba2407a7543eb7475602781","container_image":"docker.io/library/busybox:latest"}}]
During the inspection of the log file we saw the unprocessed log pieces produced by the logger application. The described Fluent Operator setup is quite simple and fits use cases with a small amount of workloads, where the logs can be stored on the host filesystem or archived to some remote storage and easily accessed from there. However, in the modern world of microservices and many applications running in clusters, we need a more efficient way to observe the logs. Let’s move to a more complex example showing the Fluent Operator integration with Grafana Loki.
Let’s explore a more complex Fluent Operator use-case - integration with Loki logs aggregator.
First of all we need to install Loki as well as Grafana dashboard to the grafana-loki cluster’s namespace using Helm charts to prepare the observability setup. We also need to configure them so that Loki is imported to Grafana as a data source and Grafana itself is exposed to the outside world. See the values below that we redefine for the Loki and Grafana Helm charts.
loki:
  auth_enabled: false
ingress:
  enabled: true
  annotations:
    cert-manager.io/cluster-issuer: letsencrypt-production
  hosts:
    - grafana.livewyer.com
  tls:
    - secretName: "grafana-tls"
      hosts:
        - grafana.livewyer.com
datasources:
  datasources.yaml:
    apiVersion: 1
    datasources:
    - access: proxy
      name: Loki
      type: loki
      # Kubernetes service for Loki
      # running in the same namespace with mapped port
      url: http://loki:3100
After both Loki and Grafana have been installed we can set the Fluent Bit configuration to forward logs to the Loki aggregator. In order to achieve that we need to create another Fluent Bit ClusterOutput cluster resource with the Loki output plugin. This custom resource will configure Fluent Bit to forward all the logs to the specified Loki instance and port. Another important config parameter to enable is autoKubernetesLabels, so that Fluent Bit can propagate all the logs with Kubernetes labels assigned to the corresponding workloads – which will be useful for filtering the logs in a Grafana dashboard.
Use the command kubectl apply -f fluent-output-loki.yaml to create this ClusterOutput.
apiVersion: fluentbit.fluent.io/v1alpha2
kind: ClusterOutput
metadata:
  name: loki
  namespace: fluent-operator
  labels:
    fluentbit.fluent.io/enabled: "true"
    fluentbit.fluent.io/component: logging
spec:
  match: "*"
  loki:
    host: loki.grafana-loki
    port: 3100
    autoKubernetesLabels: "on"
    lineFormat: "json"
One more config change is needed to enrich the logs in Loki with Kubernetes/user-assigned labels – we need to edit the existent Fluent Bit ClusterFilter custom resource called kubernetes. Let’s check we have one first:
$ kubectl get clusterfilters.fluentbit.fluent.io kubernetes -o yaml
apiVersion: fluentbit.fluent.io/v1alpha2
kind: ClusterFilter
metadata:
  name: kubernetes
spec:
  filters:
  - kubernetes:
      labels: false
      annotations: false
      kubeCAFile: /var/run/secrets/kubernetes.io/serviceaccount/ca.crt
      kubeTokenFile: /var/run/secrets/kubernetes.io/serviceaccount/token
      kubeURL: https://kubernetes.default.svc:443
<--------- skipped --------->
  match: kube.*
This ClusterFilter contains a set of rules which are effectively the Filter plugins in the Fluent Bit config. The one we need to edit is kubernetes and its particular config parameters are labels and annotations, which should be both set to true. We can use the command kubectl edit clusterfilters.fluentbit.fluent.io kubernetes and enable both fields. Here is how the ClusterFilter looks afterwards:
$ kubectl get clusterfilters.fluentbit.fluent.io kubernetes -o yaml
apiVersion: fluentbit.fluent.io/v1alpha2
kind: ClusterFilter
metadata:
  name: kubernetes
spec:
  filters:
  - kubernetes:
      labels: true
      annotations: true
      kubeCAFile: /var/run/secrets/kubernetes.io/serviceaccount/ca.crt
      kubeTokenFile: /var/run/secrets/kubernetes.io/serviceaccount/token
      kubeURL: https://kubernetes.default.svc:443
<--------- skipped --------->
  match: kube.*
Now that we’ve made all needed config changes we can check that the Fluent Bit config includes the Loki Output:
$ kubectl get secrets -n fluent-operator fluent-bit-config -o jsonpath="{.data['fluent-bit\.conf']}" | base64 -d
[Service]
    Http_Server    true
    Parsers_File    parsers.conf
<--------- skipped --------->
[Filter]
    Name    kubernetes
    Match    kube.*
    Kube_URL    https://kubernetes.default.svc:443
    Kube_CA_File    /var/run/secrets/kubernetes.io/serviceaccount/ca.crt
    Kube_Token_File    /var/run/secrets/kubernetes.io/serviceaccount/token
    Labels    true
    Annotations    true
<--------- skipped --------->
[Output]
    Name    file
    Match    *
    Path    /tmp/fluent-logs
[Output]
    Name    loki
    Match    *
    host    loki.grafana-loki
    port    3100
    line_format    json
    auto_kubernetes_labels    on
The config now contains new loki Output as well as enabled labels and annotations in the kubernetes Filter.
We can optionally check the logs of the Fluent Bit pods to see if the latest config has been applied:
$ kubectl logs -n fluent-operator fluent-bit-8ndcs
<--------- skipped --------->
level=info time=2024-02-21T13:29:00Z msg="Config file changed, stopping Fluent Bit"
[2024/02/21 13:29:00] [engine] caught signal (SIGTERM)
level=info time=2024-02-21T13:29:00Z msg="Sent SIGTERM to FluentBit, waiting max 30s"
<--------- skipped --------->
level=info time=2024-02-21T13:29:01Z msg="Fluent bit started"
<--------- skipped --------->
[2024/02/21 13:29:01] [ info] [filter:kubernetes:kubernetes.1] testing connectivity with API server...
[2024/02/21 13:29:01] [ info] [filter:kubernetes:kubernetes.1] connectivity OK
[2024/02/21 13:29:01] [ info] [output:loki:loki.1] configured, hostname=loki.grafana-loki:3100
[2024/02/21 13:29:01] [ info] [output:file:file.0] worker #0 started
<--------- skipped --------->
According to the tail of the log we get that Fluent Bit has been restarted with new output:loki configured as well as filter:kubernetes connected to API server.
Now Fluent Bit has been configured to integrate with Loki! We can go to the Grafana dashboard URL specified in grafana-values.yaml before and try to retrieve some logs of our logger application. We will use the app=logger label filter for our application logs.
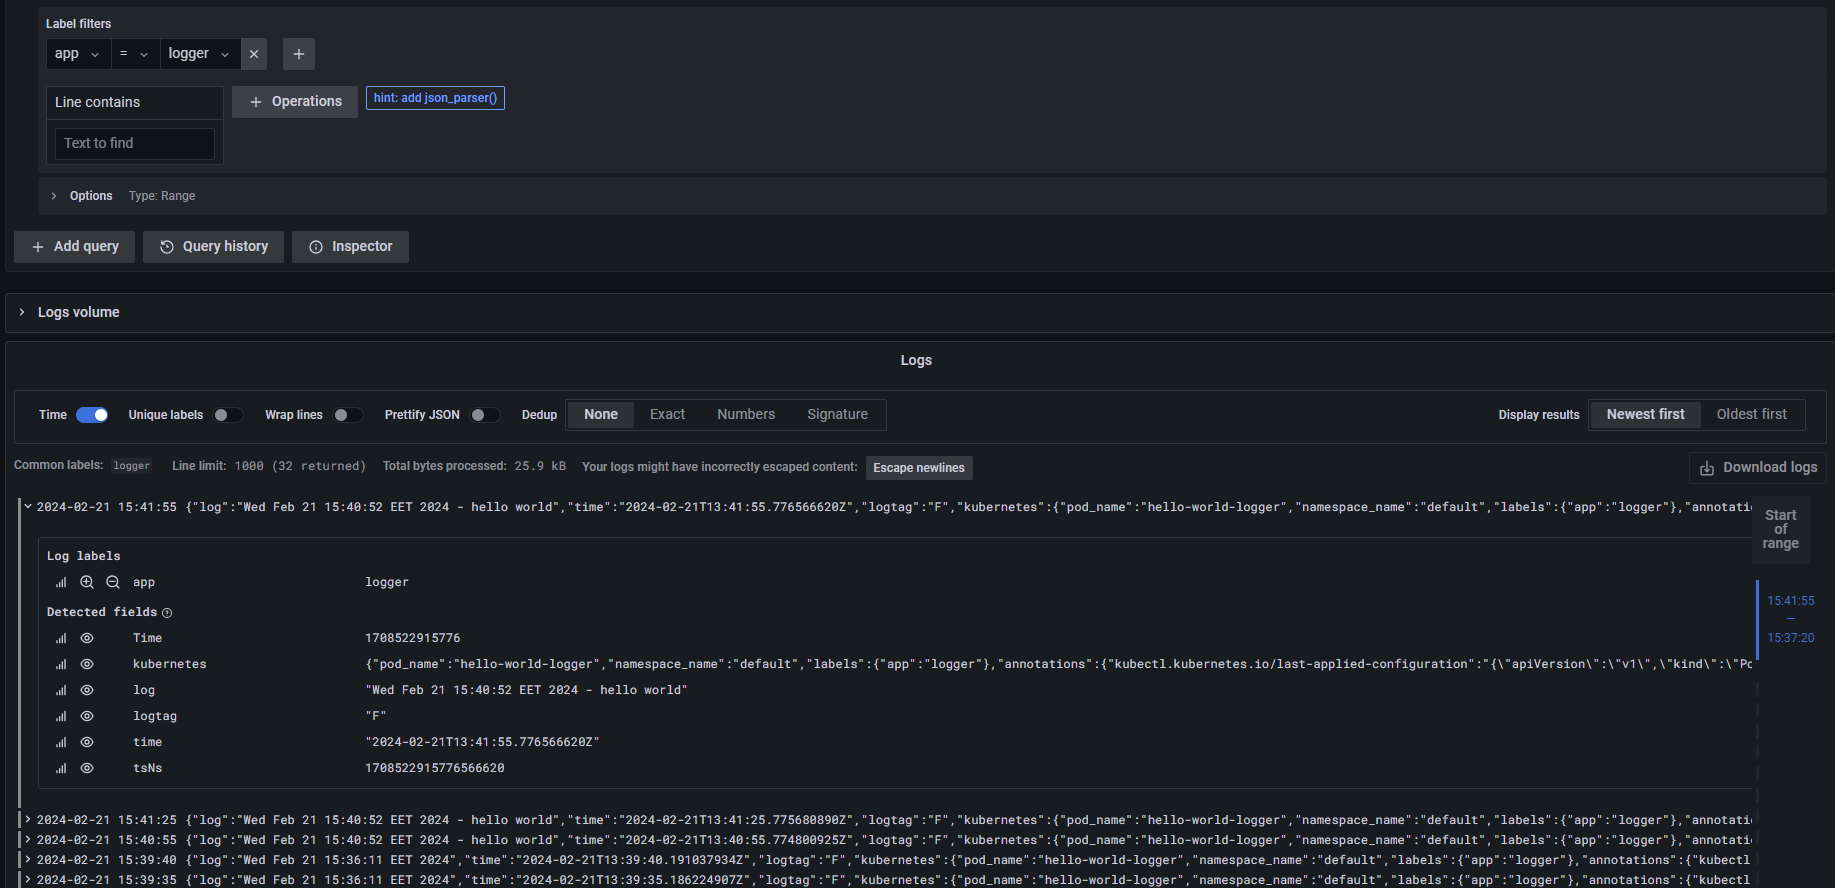
The above screenshot reflects the Grafana dashboard showing processed and structured logs for the logger application collected by Fluent Operator and processed by Loki. It’s also fair to say that this setup fits clusters with lots of workloads, as Fluent Operator scrapes the logs for all workloads and passes that to the log processor such as Loki using different plugins.
To sum up, Fluent Operator is a powerful controller that can easily manage complex configurations at scale for both Fluent Bit and Fluentd, making it a great logging option for modern Kubernetes clusters. Support of a large variety of plugins allows the ability to integrate Fluent Operator in different tech stacks and solve various observability problems. The valuable features supported by Fluent Operator help to decrease the observability’s downtime to zero, which is one of the main points of cutting-edge Cloud Native applications.